Sales forecasting is all about predicting future revenue. It’s a mix of art and science, where businesses dig into historical data, keep an eye on market trends, and analyze what the sales team is doing right now. The methods can be as simple as an educated guess from a seasoned sales leader or as complex as an AI-powered model sifting through massive datasets for hidden clues.
At the end of the day, the goal is the same: to build a reliable financial roadmap that helps you plan your next move.
Why Accurate Sales Forecasting Is Your Secret Weapon

In the B2B SaaS world, just winging it with your revenue predictions is a fast track to failure. Accurate forecasting is the bedrock of a smart business strategy, shaping crucial decisions across the entire company. Think of it less like guessing and more like creating a detailed financial map before a long road trip.
This isn’t about gazing into a crystal ball. It’s a real discipline that blends past performance data, a deep understanding of your market, and the right technology. Get it right, and you’ll unlock the insights needed to grow sustainably and run a tight ship.
The Strategic Impact of a Solid Forecast
A trustworthy forecast is so much more than a number you hand off to the finance department. It’s a powerful guide for allocating resources, getting every team on the same page, and setting clear benchmarks for success. A solid forecasting process directly shapes:
- Strategic Planning: You can confidently set budgets for hiring, marketing campaigns, and product R&D.
- Resource Allocation: It helps you figure out if you have enough sales reps and support staff to meet demand—without burning cash on unnecessary hires.
- Performance Management: You can set realistic sales quotas and spot which reps or teams might need a bit more coaching to hit their goals.
- Investor Confidence: A solid forecast shows you have a firm handle on your business, which is exactly what investors want to see when you’re raising funds.
An accurate sales forecast helps a company switch from being reactive to proactive. It gives leaders the ability to see challenges coming, jump on opportunities, and guide the business with intention, not just intuition.
A Preview of Key Forecasting Approaches
To build this financial roadmap, Revenue Operations (RevOps) teams have a whole toolkit to choose from. We’re going to walk through four main types of forecasting sales techniques, each with its own sweet spot. Think of them as a ladder, starting with simple, gut-feel methods and climbing up to sophisticated, data-heavy systems.
The four pillars we’ll cover are:
- Qualitative Techniques: This is all about relying on the expert judgment and “gut feel” of your sales leaders and reps on the ground.
- Time-Series Analysis: Here, you use your own historical sales data as a crystal ball to project what’s coming next.
- Causal Models: This gets a bit deeper, looking at the cause-and-effect relationships between your sales and things like ad spend or marketing efforts.
- Machine Learning (AI) Models: This is the high-tech approach, where algorithms find complex patterns in your data that a human could never spot.
Once you get a handle on these methods, your RevOps team can start turning mountains of data into the kind of actionable insights that lead to predictable, healthy growth.
The Four Core Sales Forecasting Techniques Explained
Trying to pick the right sales forecasting technique can feel a bit like choosing a car for a road trip. Are you cruising down a familiar, straight highway? Or are you heading into uncharted territory? The best tool for the job really depends on the road ahead.
Let’s break down the four main ways to predict sales. We’ll use some simple analogies to get a feel for how each one works and where it shines.
Qualitative Forecasting: The Expert’s Gut Check
Imagine you’re launching a brand-new product into a market you’ve never touched. You don’t have a single data point from the past to guide you. What do you do? You turn to the seasoned experts on your team—the people who’ve navigated these kinds of waters before.
That, in a nutshell, is qualitative forecasting. It’s all about relying on human judgment, experience, and intuition when hard data is thin on the ground. This is the go-to method for early-stage startups or any business venturing into the unknown.
- Jury of Executive Opinion: This is where your leadership team gets together, shares their insights, and collectively agrees on a forecast. It’s a top-down view from your most experienced players.
- Sales Force Composite: You go straight to the source—your sales reps. They’re on the front lines, talking to customers every day, so you gather their predictions from the ground up to build a forecast.
This approach is definitely more art than science, but it’s fast and gives you a vital starting point when you have nothing else to work with.
Time-Series Analysis: The Historian’s Method
Now, think about a well-established retail business. They’ve been around for years and know that sales always spike around the holidays and take a dip in late summer. They can make a pretty solid guess about the future just by looking at what’s happened in the past.
This is Time-Series Analysis. It works on the assumption that history will repeat itself. You take your historical sales data, find the patterns—like trends and seasonal cycles—and project them forward. It’s a bit like driving while looking in the rearview mirror; it works great on a straight road, but you might miss a sharp turn up ahead.
This is a step up into the world of statistical modeling, using methods like moving averages and exponential smoothing to make predictions. For businesses with stable sales cycles, it’s incredibly reliable. You can dive deeper into these statistical models and how they’re used over at Outreach.io.
Causal Models: The Detective’s Approach
Let’s say your SaaS company notices something interesting: every time you double your ad spend on a particular platform, new sign-ups jump by a predictable 30%. You’ve just uncovered a cause-and-effect relationship.
This is the central idea behind Causal Models. Instead of just looking at past sales, this technique plays detective, trying to figure out why sales go up or down. It connects the dots between your revenue and other factors, like your marketing budget, website traffic, or even external things like what your competitors are doing.
Causal models are so valuable because they show you which levers you can actually pull to change your results. If you know that a certain marketing campaign drives sales, you can confidently invest more in it to crush your targets.
This approach requires more data and a bit more analytical muscle, but the payoff is a much richer understanding of what truly drives your business.
Machine Learning and AI: The Futurist’s Toolkit
Finally, imagine a system that sifts through thousands of data points at once—every sales call, every email opened, every website click, and every CRM note. It can spot subtle patterns that no human ever could.
Welcome to the world of Machine Learning (ML) and AI. This is the most advanced forecasting technique of the bunch. ML algorithms can chew through massive, messy datasets to find complex connections that influence sales. For example, an AI model might figure out that a deal is far more likely to close if a prospect watches a specific demo video within 48 hours of their first sales call.
This method is hungry for data and gets smarter over time, offering incredible accuracy for companies that have the data infrastructure to support it. It’s like having a GPS that doesn’t just show you the destination but also reroutes you in real-time to avoid traffic jams you don’t even see yet.
To make it easier to see how these four methods stack up, we’ve put together a quick comparison table. It breaks down the core idea behind each one, where it works best, what kind of data you’ll need, and its biggest limitation.
A Quick Comparison of Sales Forecasting Techniques
| Technique | Core Concept | Best For | Required Data | Primary Limitation |
|---|---|---|---|---|
| Qualitative | Relies on expert opinion, intuition, and human judgment. | New products, new markets, or startups with no historical data. | Expert opinions, market surveys, sales team feedback. | Highly subjective and can be biased by individual opinions. |
| Time-Series | Assumes future sales will follow past patterns and trends. | Mature businesses with stable, predictable sales cycles. | Historical sales data (at least 2-3 years). | Fails to predict shifts from major market changes or new events. |
| Causal | Identifies cause-and-effect relationships between sales and other variables. | Businesses wanting to understand and influence sales drivers. | Sales data plus data on related variables (e.g., marketing spend, web traffic). | Can be complex to build and requires a clear understanding of what drives sales. |
| Machine Learning/AI | Uses algorithms to find complex, hidden patterns in vast datasets. | Data-rich companies seeking the highest level of accuracy and predictive power. | Large, diverse datasets (CRM, marketing, product usage, etc.). | Requires significant data infrastructure, technical expertise, and can be a “black box.” |
Choosing the right technique isn’t about finding the “best” one overall, but about finding the one that best fits your business’s current stage, data maturity, and strategic goals. Often, the most effective approach is actually a blend of a few different methods.
Choosing the Right Forecasting Method for Your Business
Picking the perfect sales forecasting technique isn’t about finding some magic formula. It’s more like choosing the right tool for the job. In B2B SaaS, there’s simply no one-size-fits-all solution. The best approach for you will depend on your company’s unique situation—your growth stage, how good your data is, and what’s happening in your market.
Think of it this way: a brand-new startup with zero sales history trying to use a complex, data-heavy model is like a chef trying to follow a recipe with an empty pantry. It just won’t work. On the flip side, a huge enterprise with years of clean CRM data that still relies on gut-feel predictions is leaving a ton of accuracy on the table.
To help you figure out where to start, this decision tree provides a simple framework based on your data and market stability.
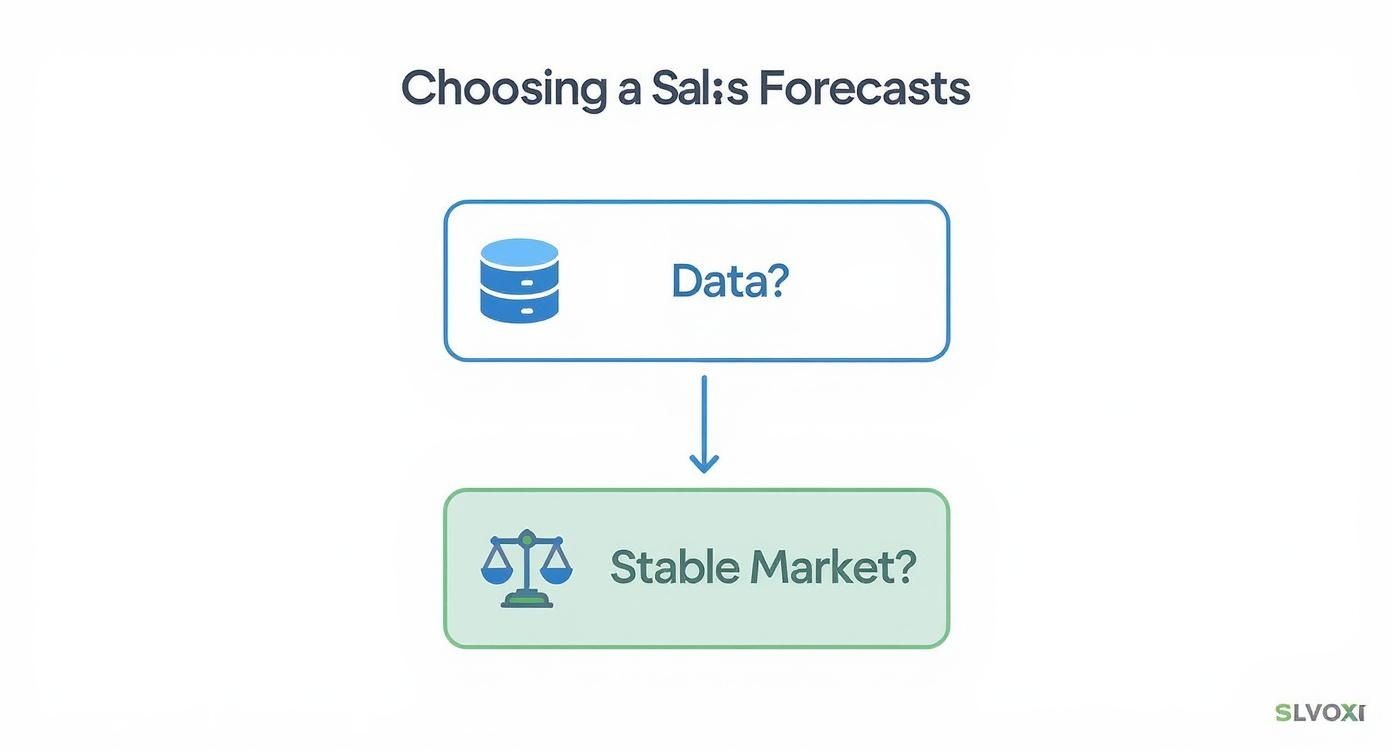
As you can see, the journey begins with one crucial question: do you have enough reliable historical data? Your answer immediately points you toward the right set of tools for your business.
Factors That Shape Your Decision
To land on a primary forecasting model that fits your resources and goals, you need to take an honest look at your company across a few key areas. Each one acts as a signpost guiding you to the most effective method.
- Company Stage and Market Position: Are you a scrappy startup or a mature market leader? Startups usually don’t have much historical data, which makes qualitative methods like getting input from the sales team or leadership essential for those first forecasts. Established companies with a steady track record can lean on more quantitative approaches.
- Data Quality and Volume: This is the big one. Using past sales data has become a go-to technique for predicting revenue, especially for established companies with consistent sales patterns. But its success hinges on clean data and a stable market. You really need at least 2-3 years of solid sales data to spot reliable patterns. You can find more winning tactics for historical forecasting over at Akucast.com.
- Sales Cycle Length and Complexity: A short, straightforward sales cycle can often be predicted well with a simple time-series model. But a long, complex B2B sales process with tons of stakeholders usually needs a more detailed approach, like opportunity stage forecasting, which calculates the odds of a deal closing based on where it is in the pipeline.
- Market Stability and Predictability: Is your market calm or chaotic? In a stable industry, historical data is a trustworthy guide. If your market is constantly shifting because of new tech or intense competition, a causal model that factors in outside influences—or even a qualitative method—might give you a more realistic picture.
Your forecasting method isn’t set in stone. The goal is to start with a primary model that fits your current reality, and then layer in other techniques over time to refine accuracy as your business and data mature.
At the end of the day, RevOps leaders have to pick a method that strikes the right balance between accuracy, effort, and insight. A simple, understandable forecast that the whole team can trust is far more valuable than a complex “black box” model that nobody can explain or act on.
Your Blueprint for Implementing a Sales Forecast

Picking the right forecasting technique is half the battle. The other half—the one that actually counts—is execution. For Revenue Operations teams, turning a great idea into a reliable, living process requires a clear plan.
This blueprint breaks that journey down into five straightforward phases. Think of it like building a house. You can’t put up walls without a solid foundation, and you can’t move in until the plumbing and electrical systems are tested and working. Each step here builds on the last, creating a forecasting engine that’s built to last.
Phase 1: Data Collection and Cleaning
Let’s start with the most important rule of forecasting: your predictions are only as good as the data you feed them. It’s that simple. When data quality is poor, it’s not uncommon for companies to miss their targets by more than 25%.
This first phase is all about getting your data in order. You’ll need to pull information from all your key systems—your CRM is the obvious one, but don’t forget marketing automation platforms or financial software. The goal is to create a single source of truth everyone can trust.
- Audit your data sources: First, map out every system that holds a piece of the sales puzzle.
- Establish a cleaning protocol: Create clear rules for handling duplicates, filling in missing fields, and standardizing entries (like deal stages).
- Automate where you can: Use tools to handle the routine data cleaning. This frees up your team from mind-numbing manual work and cuts down on human error.
Clean data is the bedrock. If you skimp on this step, you’re essentially building on sand, and the whole structure will eventually crumble.
Phase 2: Model Selection and Building
With clean data ready to go, it’s time to actually build the model. This is where you bring your chosen technique to life. You really have two main paths here: go with specialized forecasting software or build a custom model yourself, likely in a spreadsheet.
For most B2B SaaS companies, a dedicated software tool is the way to go. They come with pre-built algorithms and automation that save a ton of time. But if you’re just starting out or have simpler needs, a custom spreadsheet can be a perfectly good starting point and gives you more direct control.
A forecast model isn’t just a complicated formula; it’s a business tool designed to answer a single question: “What will our revenue be?” The best model is the one that answers that question with clarity and reliability for your team.
No matter which tool you use, this phase is about defining your inputs (like historical sales data or pipeline value) and the logic that will churn out a prediction. This is your engine.
Phase 3: Validation and Backtesting
Before you roll out your shiny new forecast across the company, you have to prove it works. This is where backtesting comes in. It’s like a dress rehearsal for your forecast—you test your model on past data to see if it would have accurately predicted what actually happened.
Let’s say you built a model in January 2024. To backtest it, you’d feed it data from 2023 and see how well its predictions line up with the actual sales results from that year. This process gives you confidence and helps you tweak the model before it goes live.
Here’s how you do it:
- Define a test period: Pick a historical timeframe to test against, like the last four quarters.
- Run the model: Plug in the historical data and generate a “forecast” for that past period.
- Measure the variance: Compare the model’s predictions to the real numbers and calculate your accuracy.
This step is non-negotiable. It’s what separates a real, data-driven process from a glorified guess and gives you the hard evidence you need to get buy-in from leadership.
Phase 4: Deployment and Reporting
Once your model is validated, it’s time to get it into the hands of your team. A forecast that lives in an isolated spreadsheet is completely useless. It has to be accessible, understandable, and actionable for everyone from sales reps to the C-suite.
This means building clear dashboards and reports that visualize the forecast. The goal is to make the information easy to digest at a glance. For example, a VP of Sales might want a high-level view of the total number, while a sales manager will need to drill down into the forecast for their specific team.
True success here means making the forecast a central part of your key sales meetings, like weekly pipeline reviews and quarterly business check-ins.
Phase 5: Monitoring and Refining
Finally, remember that a sales forecast is not a “set it and forget it” project. It’s a living system that needs regular maintenance to stay sharp. Markets change, sales processes evolve, and new data is always coming in—all things that can throw your model off.
Set a regular schedule—quarterly is a good starting point—to review your forecast’s performance against actual results. Keep an eye on your key accuracy metrics and be ready to make adjustments. This continuous loop of monitoring and refining is what ensures your forecast adapts with the business and remains a reliable guide for growth.
Measuring Your Forecast’s Accuracy and Health

Building a forecast is one thing, but how do you know if it’s any good? A prediction that consistently misses the mark isn’t just unhelpful—it can be downright dangerous for business planning. The real work begins after you’ve made your call.
You need to measure its performance to build a reliable process. This isn’t about a simple “we hit it” or “we missed it” check. To really understand the health of your forecasting sales techniques, you have to track specific metrics that show if you were off, by how much, and in which direction. This feedback loop is the secret to turning an okay forecast into a great one.
Key Metrics for Grading Your Predictions
Think of these metrics as your forecast’s report card. They give you an objective, data-backed grade on how well you’re doing, making it easy to spot weaknesses and make smart adjustments. Two of the most common statistical measures you’ll run into are Mean Absolute Error (MAE) and Mean Absolute Percentage Error (MAPE).
-
Mean Absolute Error (MAE): This metric gives you the average miss in hard dollars. It answers the question, “On average, how much were we off by?” It provides a clear, tangible sense of the error’s financial magnitude.
-
Mean Absolute Percentage Error (MAPE): This one expresses the average error as a percentage of actual sales. MAPE is incredibly useful for comparing forecast accuracy across different teams, regions, or time periods, even if their revenue numbers are wildly different.
Let’s put it this way: MAE might tell you that you missed your revenue target by $20,000. MAPE, on the other hand, would tell you that you were off by 15%. Both are valuable, but they answer different questions about your forecast’s precision.
Looking Beyond the Numbers at Forecast Bias
Accuracy metrics tell you how much you were wrong, but they don’t always tell you why. That’s where forecast bias comes in. This isn’t a hard number but a tendency—it measures whether your forecasts are consistently too high or too low.
Are your sales leaders eternal optimists, always calling a bigger number than the team can deliver? Or are they sandbagging, consistently under-calling the number to ensure a win? That’s bias.
A forecast can be statistically accurate but still biased. For example, if you consistently over-predict by just 5%, your model has a clear optimistic bias that needs to be corrected. Spotting these patterns is key to building a truly accountable system.
Identifying bias helps you understand the human element in your process. It allows you to have more productive coaching conversations and adjust your models to account for these systemic tendencies. Over time, this makes your future predictions far more reliable.
To help you get started, here’s a quick guide to the essential metrics for measuring your forecast’s performance.
Essential Forecast Accuracy Metrics
This table breaks down the core metrics you’ll want to track. Each one gives you a different lens through which to view your forecast’s performance.
| Metric | What It Measures | Simple Calculation | When to Use It |
|---|---|---|---|
| Forecast Accuracy | The percentage of the time your forecast was correct. | (1 - MAPE) | For a high-level, easy-to-understand KPI for leadership. |
| Mean Absolute Error (MAE) | The average size of the error in dollars. | Average of ( | Actual Sales - Forecasted Sales |
| Mean Absolute % Error (MAPE) | The average size of the error as a percentage. | Average of [( | Actual - Forecast |
| Forecast Bias | The consistent direction of your errors (too high or too low). | Sum of (Actual Sales - Forecasted Sales) | To identify and correct systemic optimism or pessimism in your process. |
By tracking a mix of these metrics, you move from simply making predictions to actively managing and improving your forecasting engine.
How Forecasting Techniques Work in the Real World
Theory is one thing, but let’s talk about how this all plays out on the ground. To really get a feel for these forecasting sales techniques, we’ll walk through two realistic B2B SaaS scenarios. Each company is staring down a completely different challenge, and each needs to pull a different tool from the forecasting toolbox to map out its financial future.
These stories will help connect the dots between the abstract methods and what RevOps teams actually do day-to-day to solve real problems. You’ll see pretty quickly that the “right” approach really just depends on a company’s stage, how good their data is, and what they’re trying to achieve.
Scenario 1: Growth Rocket’s Hybrid Approach
First up is ‘Growth Rocket,’ a successful scale-up sitting on three solid years of clean sales data in its CRM. Their main headache is building a quarterly forecast they can actually trust. It needs to account for past trends but also reflect the reality of their current pipeline. A simple historical model won’t cut it, but a forecast based purely on the pipeline feels a bit like guesswork.
So, their RevOps team decides to build a hybrid model, blending two powerful techniques.
- The Foundation: Time-Series Analysis: They kick things off by running a time-series model on their 36 months of historical sales data. Right away, it spits out a clear seasonal pattern: a big sales spike in Q4 as clients scramble to spend their leftover annual budgets. This gives them a solid, data-backed starting point for the quarter.
- The Refinement: Opportunity Stage Forecasting: Next, they layer on insights from their live CRM pipeline. Every deal gets a win probability based on its stage. For example, deals in “Negotiation” are pegged at an 80% chance of closing, while those way back in “Initial Qualification” are only at 10%.
By combining the historical trend (the “what”) with the current pipeline data (the “who and when”), Growth Rocket creates a forecast that’s both grounded in past performance and tuned into today’s sales motion. This blended approach gives their leadership a revenue prediction that’s much more accurate and, just as importantly, much more defensible.
Scenario 2: LaunchPad AI’s Qualitative Strategy
Now let’s look at ‘LaunchPad AI,’ a brand-new startup trying to crack a tough market. They’ve got a fantastic product but absolutely zero historical sales data. For them, any kind of time-series or causal model is a non-starter. Their challenge is to build their very first annual revenue projection from the ground up.
This is a textbook case where qualitative forecasting is the only real option.
When you have no historical data to guide you, your forecast has to be built on expertise and smart assumptions. The trick is to structure the process in a way that minimizes bias and creates a projection grounded in market reality, not just wishful thinking.
LaunchPad AI’s RevOps leader puts a structured qualitative method into action to build this make-or-break first forecast.
- Expert Interviews: They start by talking to a panel of seasoned industry experts and advisors. They’re digging for insights on market size, typical sales cycle lengths for similar products, and what a realistic first-year revenue benchmark looks like for a new player.
- Sales Team Composite: At the same time, they huddle up with their two founding sales reps. They go through the notes from their first handful of lead conversations, looking for early buying signals and getting a feel for potential deal sizes.
- Cross-Referencing and Triangulation: Finally, they bring it all together. The high-level market data from the experts acts as a reality check for the more optimistic, on-the-ground estimates coming from the sales team.
This disciplined process lets LaunchPad AI build a thoughtful, defensible first-year forecast. It gives them the financial roadmap they absolutely need to manage their cash and go after their next round of funding with confidence.
Common Questions About Sales Forecasting
Even with the best tools and processes in place, you’re bound to run into questions when building or fine-tuning your sales forecast. Let’s dig into a few of the most common ones that come up for sales and RevOps leaders.
How Often Should I Update My Forecast?
There’s no magic number here—it really depends on the rhythm of your business. A good rule of thumb is to sync your forecast updates with the length of your typical sales cycle.
- Short Sales Cycles (Transactional): If your deals close in a matter of weeks, you’ll want to review your forecast weekly. Things move fast, and you need to stay on top of the constant pipeline changes.
- Long Sales Cycles (Enterprise): When deals take months or even quarters to close, a monthly or quarterly update usually does the trick. This keeps you informed without getting bogged down in minor fluctuations.
The most important thing is consistency. Make forecasting a regular, expected part of your operational cadence, not a fire drill at the end of the quarter.
Can We Rely on Just One Forecasting Method?
It’s tempting to search for that one silver-bullet method, but the truth is, the most reliable forecasts blend two or more techniques. For example, you might use a time-series model to set a baseline and then layer on qualitative insights from your sales team about a few whale-sized deals in the pipeline.
Combining a quantitative method (the ‘what’) with a qualitative one (the ‘why’) gives you a more complete and defensible picture of future revenue, helping you avoid blind spots.
Think of it as getting a second opinion. One method gives you the hard numbers based on history, while the other adds the human intelligence needed to understand what’s really happening in the field.
What’s the Biggest Mistake to Avoid?
By far, the most common pitfall is ignoring data quality. You can have the most sophisticated AI model on the planet, but it’s completely useless if you’re feeding it garbage from your CRM. Inaccurate forecasts are almost always a symptom of poor data hygiene.
Before you spend a dime on fancy tools, get your house in order. Make sure everyone on the team is following the same process for updating deal stages, logging activities, and keeping contact info clean. Clean data is the foundation of any forecast you can actually trust.
Ready to build the rock-solid data pipelines and CRM architecture you need for accurate forecasting? The engineers at RevOps JET write production-grade code to connect your systems, clean your data, and deliver the reliable insights your team needs to hit its targets. Learn more about our services.