If you’re swimming in a sea of SaaS metrics, let me point you to the one that truly matters: Customer Lifetime Value (LTV).
Think of it this way: LTV is the total amount of money you can realistically expect to make from a customer over the entire time they’re with you. It’s not about this month’s sales or next quarter’s bookings; it’s a long-term health check for your entire business.
Why Lifetime Value Is Your SaaS North Star

Every new customer is an investment. You pour marketing dollars, sales cycles, and onboarding resources into getting them in the door. LTV is the metric that answers the million-dollar question: Was it a good investment?
This simple question forces a shift in perspective. You stop thinking about one-off transactions and start focusing on the real prize: building lasting, profitable customer relationships. Getting a handle on LTV is a game-changer because it cuts through the noise and informs your most critical business decisions.
Strategic Impact Across Teams
When everyone from RevOps and analytics to the C-suite understands lifetime value saas metrics, the guesswork disappears. It creates a common language for talking about growth.
- Marketing Strategy: LTV tells you exactly how much you can afford to spend to acquire a customer. If your average LTV is $5,000, you can play in a completely different marketing league than if it were just $500.
- Product Development: Which features drive the most value? By segmenting LTV, your product team can see what keeps customers around longer and paying more, helping them build a roadmap that actually fuels growth.
- Customer Success: A dipping LTV is your canary in the coal mine for churn. It gives your CS team a heads-up to step in and save at-risk accounts before it’s too late.
- Sales Focus: Not all customers are created equal. LTV analysis will shine a light on your most profitable segments, allowing your sales team to stop chasing every lead and focus on high-value ideal customer profiles (ICPs).
LTV is the ultimate measure of your business’s sustainability. It reveals whether you’re building a leaky bucket that constantly needs refilling or a flywheel that gains momentum with every new customer.
To quickly recap these foundational ideas, here’s a breakdown of the key components of LTV and why they are so vital for any SaaS company.
Key Components of SaaS LTV at a Glance
| Concept | What It Measures | Why It’s Important for SaaS |
|---|---|---|
| Lifetime Value (LTV) | The total revenue a business can expect from a single customer account. | It’s a forward-looking metric that signals long-term business health and sustainability. |
| Customer Acquisition Cost (CAC) | The total cost to acquire a new customer, including marketing and sales expenses. | Provides the “cost” side of the growth equation, telling you if your acquisition strategy is profitable. |
| LTV to CAC Ratio | The relationship between the lifetime value of a customer and the cost to acquire them. | This is the ultimate efficiency metric. A healthy ratio (ideally 3:1 or higher) proves your business model is scalable. |
| Customer Lifetime | The average amount of time a customer continues to do business with you before they churn. | Directly impacts LTV; the longer a customer stays, the more valuable they become. |
Understanding these pieces is the first step. Next, we’ll dive into how they all connect.
The LTV and CAC Partnership
You can’t talk about LTV without bringing its partner to the dance: Customer Acquisition Cost (CAC). CAC is simply the total amount you spend on sales and marketing to land one new customer.
These two metrics are a dynamic duo. LTV shows you the reward, while CAC shows you the cost of getting there. The real magic happens when you look at them together in the LTV to CAC ratio. This single number tells you more about the health and scalability of your SaaS business than almost anything else.
Throughout this guide, we’ll get into the nitty-gritty of calculating both, benchmarking them against the industry, and—most importantly—finding ways to improve them.
How to Calculate LTV for Your SaaS Business

Alright, let’s get down to the brass tacks of calculating Lifetime Value. It can feel like a daunting metric, but moving from the abstract concept to a concrete number is where the magic happens. We’ll look at a couple of ways to do this, from a quick-and-dirty formula that gives you a solid health check to a more advanced method that tells a much richer story about your customers.
We’ll start with the most common and direct approach. Think of this classic formula as your go-to for a baseline understanding of your LTV. It’s simple, surprisingly powerful, and gives you a single number you can start tracking today.
The Classic LTV Formula
At its core, the simplest LTV formula leans on two metrics you’re probably already tracking: Average Revenue Per Account (ARPA) and your Customer Churn Rate.
ARPA is just the average revenue you bring in from each customer account, usually on a monthly or yearly basis. The Customer Churn Rate, of course, is the percentage of customers who say goodbye during that same period.
Here’s the formula:
LTV = Average Revenue Per Account (ARPA) / Customer Churn Rate
What this calculation really does is project how much total revenue you can expect from a customer before they, inevitably, churn. It’s a fast and effective way to get a snapshot of your business’s financial health.
Let’s make this real with an example. Imagine your SaaS company is called “SyncRight” and you have these numbers:
- Average Revenue Per Account (ARPA): $200 per month
- Monthly Customer Churn Rate: 4% (which is 0.04 as a decimal)
Now, just plug those into the formula: LTV = $200 / 0.04 = $5,000
Boom. This tells you that, on average, a new SyncRight customer is worth $5,000 over their entire “lifetime” with you. That single number is incredibly useful for making smarter decisions about how much to spend on marketing, where your sales team should focus, and what product features to invest in.
The Limitations of the Simple Formula
While the classic formula is a fantastic starting point, it has one major flaw: it assumes all your customers are identical. It mashes everyone together into a single, blended average that can easily hide important nuances.
Calculating LTV in SaaS is a different beast than in traditional businesses because of the subscription model. And honestly, it’s a stumbling block for many—a shocking 42% of companies feel they can’t even measure LTV accurately. A customer paying $50/month who sticks around for 24 months is worth $1,200, while one who leaves after six months is only worth $300. That huge difference is why even a 5% boost in retention can improve profitability by 25% or more. For a deeper dive on these SaaS benchmarks, you can explore the full analysis on Contentsquare.com.
Your business isn’t static. Some customers upgrade, others downgrade, and they all churn at different rates. A simple average completely glosses over these critical trends. What if the customers you signed in May are way more valuable than the ones from January? This is exactly where you need a more sophisticated method.
Unlocking Deeper Insights with Cohort Analysis
To get a truer picture of your LTV, you need to graduate to cohort analysis. This approach is all about grouping customers into “cohorts” based on a shared characteristic—most often, the month or quarter they first signed up.
Instead of looking at one big, business-wide average, you calculate LTV for each specific cohort. This simple shift transforms LTV from a static, single number into a dynamic story that unfolds over time.
By analyzing cohorts, you can finally answer mission-critical questions like:
- Product Impact: Did that new feature we launched in Q2 actually lead to higher LTV for customers who signed up after it was released?
- Pricing Strategy: How did our pricing change in September affect the long-term value of the customers we acquired that month?
- Marketing Effectiveness: Are customers coming from our new content marketing channel sticking around longer than the ones from paid ads?
Yes, this method requires more granular data, but the payoff in actionable insights is enormous. It shows you the real-world impact of your strategic decisions, allowing you to double down on what’s working and quickly fix what isn’t. As we’ll see next, this ties directly into your Customer Acquisition Cost (CAC) to reveal the true profitability of your growth engine.
Benchmarking Your LTV to CAC Ratio for Growth
Calculating your SaaS lifetime value is a huge step forward, but that number doesn’t tell you the whole story on its own. Is an LTV of $5,000 fantastic or a total flop? The real answer hangs on one critical question: how much did it cost to get that customer in the first place?
This is where the LTV to Customer Acquisition Cost (CAC) ratio comes in. It’s the ultimate health check for your business model, giving you a clear, honest look at the efficiency of your growth engine. It cuts right to the chase, answering: “For every dollar we spend to get a new customer, how many dollars do we get back over their lifetime?”
Think of it like any other investment. If you put $1 in and get $1 back, you’ve broken even—but you haven’t actually made any money. But if you invest $1 and get $3 back? Now you’ve found a winning strategy worth doubling down on. The LTV:CAC ratio applies that same simple, powerful logic to your customer acquisition efforts.
The Gold Standard 3:1 Ratio
In the SaaS world, a 3:1 LTV to CAC ratio is pretty much the gold standard. It’s the sign of a healthy, sustainable business. Hitting this mark means you’re generating three dollars in lifetime revenue for every single dollar you spend on sales and marketing to land a customer.
This isn’t just some arbitrary number people pulled out of thin air; it points to a business that has found a powerful balance. It proves your model is profitable and, just as importantly, has enough margin left over to reinvest in your product, support your customers, and fuel even more growth. A strong ratio is one of the most convincing sales KPIs you can show investors or your board because it demonstrates a scalable and efficient path to market.
A 3:1 ratio is your growth engine’s green light. It confirms that your marketing spend isn’t just an expense—it’s a high-yield investment fueling your company’s future.
Keeping an eye on this benchmark is more critical now than ever. Recent analysis shows that customer acquisition costs have shot up by an eye-watering 222% over the last eight years. That makes an efficient growth model a matter of survival. To get a better sense of how these rising costs are shaking up the industry, you can check out more CAC ratio statistics on eqvista.com.
What Other Ratios Are Telling You
While 3:1 is the goal, other ratios can give you just as much insight into what’s happening under the hood. Understanding what they mean is the key to making the right adjustments.
-
1:1 Ratio (The Treadmill): This is your break-even point. You get one dollar back for every dollar you put in. You aren’t losing money on each new customer, but you have zero profit margin to cover operational costs or pour back into the business. It feels like you’re running as fast as you can just to stay in the same place.
-
Below 1:1 (The Danger Zone): This is a red alert. You are actively losing money on every single customer you bring on board. A model like this is completely unsustainable and means you have to either slash your CAC or find a way to increase LTV—fast.
-
5:1+ Ratio (Potential for Faster Growth): An exceptionally high ratio might seem like a dream come true, but it can actually be a sign that you’re playing it too safe. If your acquisition engine is this efficient, you might be leaving money on the table by not spending more aggressively to capture market share before a competitor does.
By keeping a close watch on this simple but profound metric, you can justify your budget, fine-tune your marketing channels, and steer your company toward predictable, long-term profitability.
Building Your SaaS LTV Data Model
Alright, let’s move from theory to the terminal. This is where the real work of calculating SaaS lifetime value begins—the part that’s built for data engineers, analytics pros, and the RevOps leaders who need to trust the numbers. We’re getting hands-on with the SQL patterns and data architecture that turn raw subscription data into a single source of truth.
A reliable LTV calculation isn’t born in a spreadsheet. It’s forged from a solid data foundation that transforms messy, raw data from systems like Stripe or Zuora into clean, aggregated metrics. This pipeline is the engine powering every LTV chart your leadership team sees. Without it, you’re just guessing.
The goal here is to create a clear, logical flow from raw events to business-ready insights. This is precisely where a tool like dbt (data build tool) becomes your best friend, helping you structure your transformations in a way that’s modular, testable, and easy to maintain.
Here’s a quick look at the dbt Cloud interface, which is fantastic for helping teams collaborate on building and deploying these kinds of data transformation workflows.
This interface gives you a central hub for developing, testing, and documenting the SQL models that will ultimately spit out your LTV metrics.
Structuring Your Data with dbt
One of the most effective ways to structure your data pipeline in dbt is using the staging, intermediate, and marts pattern. Think of it as a three-layer cake that progressively cleans, enriches, and aggregates your data. It makes the final LTV calculation both accurate and dead simple to understand.
-
Staging Models: This is your first stop. Staging models do the light-touch cleaning of your raw source data—renaming columns to be more intuitive, casting data types correctly, and other basic standardization. Each source table, like
stripe_subscriptionsorstripe_invoices, gets its own staging model. The key here is not to do any complex joins; you’re just creating a clean, reliable version of the raw stuff. -
Intermediate Models: Now the real fun begins. In this layer, you start joining your staging models to build out more complex business logic. For instance, you might create an intermediate model that calculates Monthly Recurring Revenue (MRR) per subscription or flags when a churn event happens. This layer is absolutely crucial for breaking down complex logic into smaller, reusable chunks.
-
Mart Models: These are your final, business-facing tables. A mart model for LTV would pull everything together from your intermediate models into a clean, wide table that’s ready for your BI tool. You might have one row per customer cohort per month, with columns for MRR, churn count, and cumulative revenue. This is the table that directly fuels your LTV dashboards.
Core Data Models for SaaS LTV
To get lifetime value right in SaaS, you need a few foundational data models that feed into the final calculation. These are the building blocks your RevOps JET team would put in place to make sure every metric is rock-solid.
-
Subscriptions Model: This is the absolute backbone. It needs to track the entire lifecycle of every single subscription, including
subscription_id,customer_id,plan_id,mrr,start_date, andend_date. Capturing every upgrade, downgrade, and cancellation is non-negotiable. -
MRR Movements Model: Instead of just a monthly snapshot, this model captures the change in MRR. It breaks down new business, expansion, contraction, and churn for each customer, every month. This gives you the granular data needed to understand why LTV is moving up or down.
-
Customer Cohort Model: This is where you group customers by their sign-up month. This model becomes the foundation for your cohort-based LTV analysis, letting you see how different groups of customers perform over time.
Building these models isn’t just a technical exercise; it’s about codifying your business logic. How you define “churn” or “active subscription” in SQL becomes the official definition for the entire company, creating alignment across all teams.
Predicting churn is a huge piece of any forward-looking LTV model. For a much deeper look into the data points and techniques for getting ahead of it, you can learn more about predicting customer churn and see how to build a proactive retention strategy.
Event-Based vs. Snapshot Modeling
One of the biggest architectural decisions you’ll make is whether to track subscriptions using an event-based or a snapshot-based approach. Each has its place, and knowing the difference is key.
To help you decide, here’s a quick comparison of the two main data modeling strategies for LTV.
Data Modeling Approaches for LTV Calculation
| Approach | Description | Pros | Cons |
|---|---|---|---|
| Event-Based | Captures every single change as a separate event (e.g., subscription.created, subscription.updated, subscription.canceled). | Highly accurate; captures the full history of upgrades and downgrades. Excellent for detailed analysis. | Can be complex to model and computationally intensive. Reconstructing a subscription’s state at a point in time requires more SQL logic. |
| Snapshot-Based | Takes a daily or monthly “snapshot” of the state of every subscription. | Simpler to query and reason about. Good for high-level monthly reporting. | Can miss intra-month changes (e.g., a customer upgrades and then downgrades in the same week). Less granular. |
So, which one should you choose? Honestly, for most SaaS businesses, a hybrid approach works best. Use an event-based model to capture the raw, detailed history, then build monthly snapshot tables in your marts layer to make reporting in your BI tool fast and simple. This gives you the best of both worlds: complete accuracy and high-speed reporting.
Actionable Strategies to Increase Your SaaS LTV
Knowing your LTV is just the starting line—the real race is won by actively improving it. A high LTV doesn’t just happen by accident. It’s the direct result of deliberate strategies designed to make your product stickier and more valuable to customers over the long haul.
Fundamentally, this boils down to pulling three main levers: reducing churn, increasing the revenue you get from each account, and driving expansion. We’re not talking about vague advice here. These are concrete actions your product, marketing, and success teams can rally around to build more valuable, lasting customer relationships.
Of course, to even begin tracking these initiatives, you need a solid data foundation. It all starts with raw data, which gets cleaned and transformed before landing in a data mart ready for analysis.
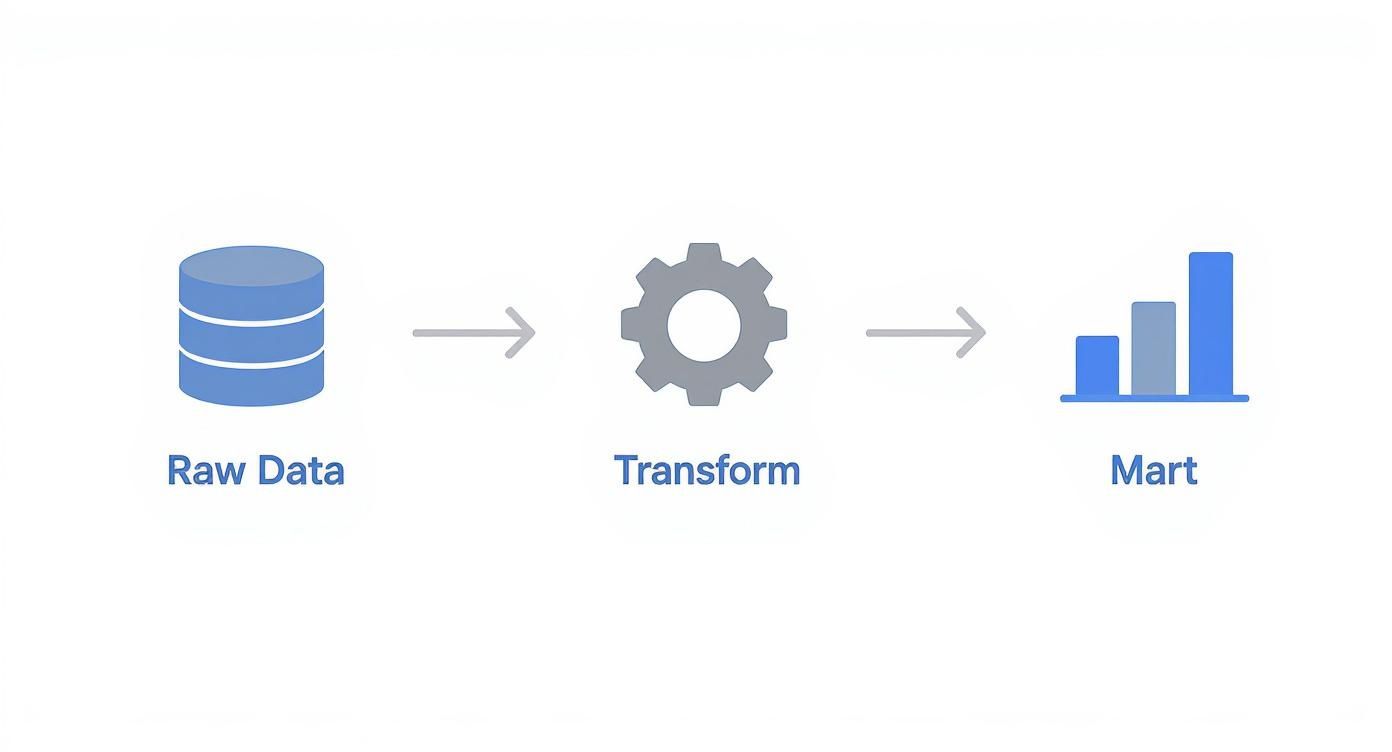
This pipeline turns raw subscription events into structured metrics, which then feed your LTV dashboards and strategic deep dives. With that in place, you can start making moves.
Nail the Onboarding Experience
Let’s be honest: a customer’s first few moments with your product are make-or-break. A clunky, confusing, or overwhelming onboarding experience is a one-way ticket to churn. The goal isn’t just to show users how your product works, but to get them to that first “aha!” moment as fast as humanly possible.
A great onboarding experience sets the stage for a long-term partnership. It builds confidence and proves your product’s value right out of the gate, making customers far less likely to jump ship. Don’t just take my word for it—a staggering 23% of customer churn is tied directly to a poor onboarding process.
This is where personalization really shines. Companies that create personalized experiences pull in 40% more revenue than their competitors. On top of that, 80% of customers are more likely to buy from brands that tailor the journey to them. By investing in a smooth, personalized onboarding flow, you’re not just plugging a leaky bucket; you’re actively boosting LTV from day one.
Drive Expansion Revenue Through Smart Upsells
The most successful SaaS businesses grow with their customers. Expansion revenue—the money you make from existing customers through upgrades, add-ons, or cross-sells—is one of the most powerful ways to pump up your LTV. It’s way cheaper than acquiring a net-new customer and serves as a powerful signal that your product is delivering real, growing value.
To do this right, you have to get inside your customers’ heads by understanding their behavior and usage patterns.
- Tiered Pricing: Structure your pricing so that upgrading is the logical next step as a customer’s needs grow. Make that next tier a no-brainer.
- Feature Gating: Keep your most advanced features for premium plans. When a user hits a usage limit or tries to access a gated feature, use an in-app prompt to show them exactly what they’re missing.
- Add-on Modules: For customers with unique needs, offer optional modules or services they can tack onto their core subscription.
Your best new customers are often your existing ones. Focusing on expansion revenue shifts your mindset from just acquiring users to growing partnerships.
But here’s the catch: this entire strategy hinges on keeping customers happy enough to stick around. You can’t upsell a customer who’s already walked out the door. Slashing churn is a non-negotiable first step. For a deeper dive, check out our guide on churn in SaaS to learn how to keep your customer base healthy and ready to grow.
Enhance the Customer Experience Continuously
Long-term value is built on a foundation of trust and a consistently positive experience. This goes way beyond that initial onboarding and demands a real commitment to proactive support and constant improvement.
A strong customer success program is your secret weapon here. Regular check-ins, reaching out to at-risk accounts before they have a problem, and a lightning-fast support system all show customers you’re invested in their success. Another fantastic tactic is building a self-service knowledge base right inside your app, letting users find answers instantly without any friction.
When you listen to feedback, iterate on your product, and provide outstanding support, you build unshakable loyalty. And loyal customers don’t just stay longer—they become your biggest fans, driving the kind of word-of-mouth growth that makes your LTV to CAC ratio look incredible.
Your Roadmap to LTV-Driven Growth
Alright, we’ve covered a ton of ground. We’ve gone from calculating a basic LTV to designing a full-blown data model that can actually steer the ship. Now, let’s put it all together into a clear, actionable plan to turn your business into an LTV-driven machine.
Think of this as your blueprint for building real, sustainable growth. Because mastering LTV isn’t a one-and-done project. It’s about weaving a new way of thinking into your company’s DNA, where long-term value guides every single decision. That cultural shift is the real win here.
Your Step-by-Step Action Plan
The key is to start with a solid foundation. You don’t need to boil the ocean on day one. It’s all about building momentum with small, deliberate steps.
-
Define and Align: First things first, get your key people from finance, marketing, and product in the same room. Your mission? Hammer out precise, agreed-upon definitions for your core metrics like MRR, churn, and ARPA. This step is absolutely non-negotiable if you want a single source of truth.
-
Calculate Your Baseline: Kick things off with the simple LTV formula (ARPA / Churn Rate). This gives you an immediate number to work with and improve upon. Once you’re comfortable with that, it’s time to graduate to a cohort-based analysis to really see how customer behavior changes over time.
-
Build Your Data Model: Now, you can start building out your data pipeline. Create your staging models to get the raw subscription data clean, then build the intermediate models for MRR movements and customer cohorts. This is what creates that reliable foundation you need for accurate dashboards in your BI tool.
The real goal here is to make LTV the shared language of growth across all your teams. When marketing, sales, and product are all pulling in the same direction, optimizing for the same north-star metric, you create a seriously powerful growth engine.
Executing for Continuous Improvement
Once your data infrastructure is humming along, you can pivot your focus to execution. It’s time to prioritize the strategies that directly pull on the two main LTV levers: retention and expansion.
This means absolutely nailing your customer onboarding, getting smarter about identifying upsell opportunities, and never stopping when it comes to improving the customer experience.
By following this roadmap, you’ll stop measuring lifetime value saas and start actively managing it. You’ll give your teams the power to make data-informed decisions that build more valuable, longer-lasting customer relationships—and drive the kind of growth that actually lasts.
Common Questions About SaaS LTV
Alright, you’ve got the basics down, but let’s be honest—that’s when the real questions start popping up. Moving from theory to practice with LTV always brings a few head-scratchers. Let’s walk through some of the most common ones I hear from teams trying to get this right.
What Is a Good LTV for a SaaS Company?
This is the million-dollar question, isn’t it? The truth is, a “good” lifetime value saas number on its own doesn’t mean much. It’s all relative. The real metric you need to obsess over is its relationship with your Customer Acquisition Cost (CAC). That’s where the LTV to CAC ratio comes in.
As a rule of thumb, the gold standard for a healthy SaaS business is a 3:1 ratio. For every dollar you spend to win a customer, you should be getting three dollars back over their lifetime. This simple ratio tells you if you have a viable business model with enough margin to cover all your costs and still invest in growth.
Think of it this way:
- 1:1 Ratio: You’re basically running in place. You make just enough to cover what you spent to get the customer, leaving nothing for operations or profit. Not a recipe for success.
- 5:1+ Ratio: This looks amazing on the surface, but it might actually be a red flag. It could mean you’re not spending enough on sales and marketing and are leaving growth on the table.
So, stop focusing on the standalone LTV number. Start focusing on the ratio.
How Often Should We Calculate and Review LTV?
Finding the right rhythm for calculating and reviewing LTV really depends on how fast your business is moving. For most SaaS companies, checking in monthly or quarterly is the sweet spot.
Monthly calculations are perfect for keeping a pulse on things. You can quickly spot how a recent pricing change or a new marketing campaign is affecting customer value. Quarterly reviews, however, are where you zoom out. They help you smooth out the monthly blips and see the bigger, more strategic trends in customer behavior over time.
If you’re an early-stage startup, you might even look at it more frequently. But for more established companies, a deep dive every quarter or year is usually plenty.
Which Tools Are Best for Tracking and Modeling LTV?
Your tech stack for this depends entirely on your team’s skills and how complex your business is. You can really go one of two ways here.
The first route is building it yourself with a modern data stack, which gives you ultimate flexibility. This setup usually looks something like this:
- A data warehouse like Snowflake or BigQuery to get all your data in one place.
- A transformation tool like dbt to handle all the tricky subscription logic using SQL.
- A BI platform like Looker or Tableau to bring your LTV dashboards to life.
The other option is to use an off-the-shelf tool that does the heavy lifting for you. Platforms like ChartMogul or Baremetrics plug right into payment systems like Stripe and crunch the numbers automatically, giving you pre-built dashboards for LTV and other critical metrics right out of the box.
Let’s be real: building and managing the data pipelines for accurate LTV is a huge engineering lift. RevOps JET offers expert, on-demand RevOps engineering to design and run these systems for you. We handle everything from Salesforce-to-Snowflake pipelines to production-ready dbt models, so you get reliable data without the hiring headaches. Check us out at https://revopsjet.com.