Think of a SaaS ROI calculator as your secret weapon for turning technical value into a language finance leaders can’t ignore: financial proof. It’s how you shift the conversation from nifty features to real, measurable fiscal impact, showing leadership exactly how a RevOps investment boosts the bottom line.
Why a SaaS ROI Calculator Is Your Most Important Tool

Let’s be real: in a world of tightening budgets and skeptical CFOs, justifying RevOps spending on a hunch is a recipe for disaster. The pressure to prove value is intense, and every new tool or service is a line item under a microscope. A solid business case, backed by hard numbers, isn’t just a nice-to-have anymore—it’s critical.
This is where a well-built saas roi calculator becomes your most persuasive storytelling tool. It’s more than just a spreadsheet; it’s about translating the operational magic we create in RevOps into the only language that matters in the boardroom: dollars and cents.
The New Financial Reality
The SaaS world has grown up. The “growth at all costs” era is officially over, and economic headwinds are forcing a laser focus on efficiency and profitability.
Just look at the recent market shifts:
- Slower Growth: Median growth rates have settled around 19-21%, a far cry from the 40%+ we saw just a few years ago.
- Profitability Pressure: Only 44% of SaaS companies are actually EBITDA positive, meaning every single dollar spent is being scrutinized.
- Longer Payback Periods: The median Customer Acquisition Cost (CAC) Payback Period has crept up to 20 months, well above the historical target of 12-14 months.
This tough environment means a precise ROI calculation isn’t optional for any new investment. If you want to dive deeper, you can explore the latest SaaS benchmarks to get a better handle on these trends.
Key Metrics That Demand a Solid ROI Case
A quick look at the critical SaaS financial metrics that underscore the need for rigorous ROI analysis for any RevOps investment.
| Metric | Industry Benchmark | Why It Matters for Your ROI Calculator |
|---|---|---|
| CAC Payback Period | 12-20 months | Your calculator must show how the investment speeds up this payback, proving faster time-to-value. |
| Net Revenue Retention (NRR) | 100%+ | Frame your investment’s impact on reducing churn or enabling upsells, directly boosting NRR. |
| Customer Lifetime Value (LTV) to CAC Ratio | 3:1 or higher | Demonstrate how your solution increases LTV or decreases CAC, improving this core efficiency metric. |
| Gross Margin | 70-80%+ | Quantify how your project reduces operational costs or automates tasks, directly improving margins. |
Ultimately, your calculator needs to speak directly to these core business health indicators to make a truly compelling case.
Translating Technical Value into Business Impact
The primary job of your calculator is to connect the dots between technical execution and financial results. It answers the “so what?” question that’s on every executive’s mind.
For instance, improving data reliability isn’t just a technical win; it’s a direct reduction in business risk. Reclaiming engineering hours isn’t just an efficiency play; it’s a hard, quantifiable cost saving that hits the bottom line.
A great SaaS ROI calculator doesn’t just justify a purchase; it builds a compelling narrative around strategic value. It shows how operational improvements directly fuel financial health and competitive advantage.
By putting real numbers to both hard savings (like reclaimed engineering hours) and strategic gains (like better scalability and faster decision-making), you build a case that’s impossible to ignore. This guide will walk you through, step-by-step, how to construct a calculator that gives you the evidence you need to champion your team’s impact and get the resources you deserve.
Getting the Right Numbers for a Believable ROI
Any ROI calculator is only as good as the numbers you plug into it. We’ve all heard the old “garbage in, garbage out” saying, and when you’re trying to build a business case for your CFO, it’s a critical warning. To get this right, we need to look past the obvious invoice line items and start digging into the real, often hidden, costs and benefits.
Think of it like putting together a puzzle. You need all the pieces—the hard costs, the soft costs, and the opportunity costs—to see the complete picture of what an investment will truly do for the business.
Your Team’s Time is More Expensive Than You Think
First things first, let’s figure out the actual cost of your team’s time. This is probably the most important input for your calculator. Just using someone’s salary won’t cut it; you need their fully-loaded hourly rate. This is the number that represents what one hour of an employee’s time actually costs the company.
You’ll need to grab a few figures from your finance or HR team to work this out:
- Gross Annual Salary: This is just their base pay.
- Benefits & Payroll Taxes: This usually adds another 25-40% on top of salary. It covers things like health insurance, retirement plans, and other employer-paid taxes.
- Productive Annual Hours: A standard full-time employee is on the clock for about 2,080 hours a year, but nobody is productive for all of that. A much more realistic figure is somewhere between 1,800-1,900 hours once you account for PTO, holidays, and training days.
With those numbers in hand, the formula is straightforward: (Gross Salary + Benefits & Taxes) / Productive Annual Hours. Voilà. You now have a solid, defensible number for every single hour your new tool will save.
My Two Cents: Don’t use a single blended rate for everyone. A senior engineer’s hour is worth a lot more than a junior analyst’s. Breaking these costs down by role will make your final calculation far more accurate and a lot more persuasive.
Nailing Down the Hard Costs and Direct Savings
Okay, this is the easy part. These are the tangible expenses and clear financial wins you can pull directly from invoices and budgets.
Here’s a quick checklist of what to look for:
- Software License Fees: The subscription cost for the new SaaS tool. For a platform like RevOps JET, this would be the straightforward monthly or annual fee.
- Costs of Old Tools: If this new solution is replacing something you already use, make sure you capture the full cost of the old tool you’re turning off. Don’t forget to include any sneaky add-on fees or overage charges you pay regularly.
- Setup and Training: Factor in any one-time implementation fees or the cost of the hours your team will spend getting trained up on the new system.
- Consultant or Freelancer Bills: Are you paying outside consultants, agencies, or freelancers for work the new tool would handle? Add that spending to your list.
Putting a Price on Inefficiency
This is where a good ROI analysis turns into a great one. The biggest productivity killers for most RevOps teams aren’t on any P&L—they’re the “invisible” costs of manual work, buggy integrations, and mounting technical debt. Your job is to make them visible by slapping a dollar amount on them.
Start by having honest conversations with your team. Ask them things like:
- How many engineering hours a week are we burning on surprise bug fixes for our data pipelines?
- How long does it take to launch a new campaign because we’re waiting on a data sync to run?
- How often are we forced to make big decisions using data we don’t really trust?
The answers to these questions help you quantify opportunity cost. Every hour one of your best engineers spends patching a broken Salesforce sync is an hour they aren’t building a valuable new product feature. By attaching their fully-loaded hourly rate to that lost time, you turn a vague frustration into a concrete financial loss.
This is why building things right the first time is so important. Getting familiar with some fundamental data integration best practices can help you understand how to prevent these kinds of costly problems from cropping up in the first place.
Let’s Build Your ROI Calculator Model
Alright, you’ve gathered the raw data. Now for the fun part: rolling up our sleeves and actually building the calculator. Forget the intimidating financial jargon for a moment. We’re going to break down the essential formulas into plain English so you can plug them right into your favorite spreadsheet tool.
The goal here is to create a model that’s both easy to use and solid enough to stand up to scrutiny from your finance team. It all starts with visualizing the key inputs: the cost of your team’s time, the hard costs of the software itself, and the often-overlooked value of sidestepping potential risks.
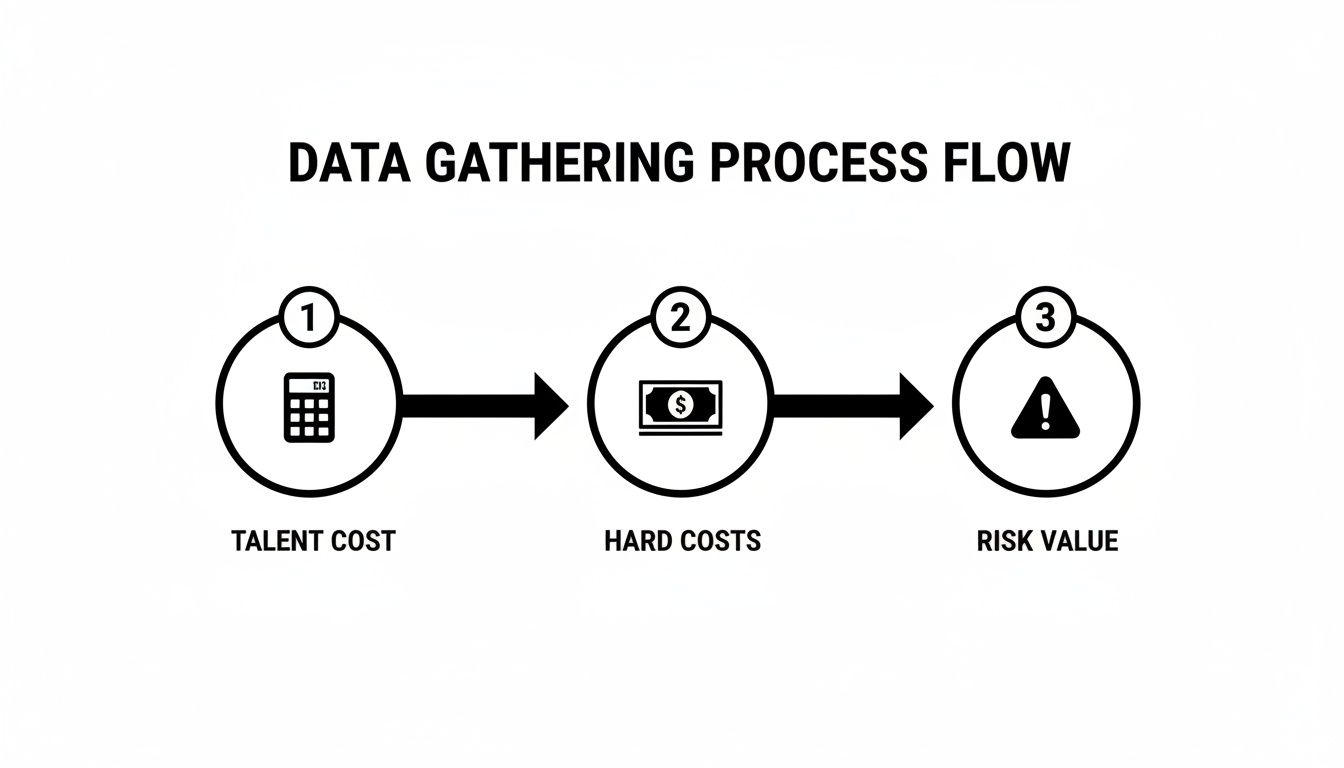
This flow shows how all the pieces fit together, moving from direct expenses to more strategic, risk-based thinking. It’s the foundation of a credible calculator.
First, Nail Down the Total Cost of Ownership
Before you can calculate any return, you have to know what you’re truly spending. This is where Total Cost of Ownership (TCO) comes in. It’s the complete picture of all costs tied to a new SaaS tool, going way beyond the sticker price you see on the website.
It’s a classic mistake to only focus on the subscription fee. A reliable SaaS ROI calculator has to account for everything.
- Subscription Fees: This one’s the most obvious cost. For a service like RevOps JET, it’s the straightforward monthly fee.
- Implementation & Setup: Think about any one-time costs to get the service up and running.
- Training & Onboarding: This is the cost of your team’s time spent learning the new system. It’s not free.
- Ongoing Maintenance: How much time will your team spend managing the tool? With a managed service, this should be close to zero, but it’s still important to consider.
The formula is just simple addition:
TCO = Subscription Fees + Implementation Costs + Training Costs + Maintenance Costs
This final number is the “I” (Investment) in your ROI calculation. It’s your total financial commitment, no hidden surprises.
Quantifying the Real-World Cost Savings
This is the core of your business case. For any RevOps team, the biggest win usually comes from reclaiming expensive, highly skilled engineering hours. Right now, those hours are likely being sunk into repetitive tasks, manual data pipeline maintenance, or fixing annoying bugs.
Let’s imagine your internal team spends 300 hours per year on these kinds of activities. If you use that fully-loaded hourly rate we talked about—let’s say $150/hour for a senior engineer—the math becomes crystal clear.
Annual Savings = Hours Saved Annually x Fully-Loaded Hourly Rate
Annual Savings = 300 hours x $150/hour = $45,000
That $45,000 is a real, defensible number you can confidently take to your CFO. It’s not some vague promise of “better efficiency”; it’s a direct operational saving.
The All-Important Payback Period
Your leadership team will always ask this question: “How quickly do we make our money back?” The Payback Period is your answer. It tells you exactly how many months it will take for the savings to completely cover the initial investment.
The Payback Period is a powerful metric because it speaks directly to cash flow and risk. A shorter payback period means a faster return and less time for the investment to be “underwater.”
To figure it out, just divide your total investment by your net monthly savings.
Payback Period (in months) = Total Investment / (Monthly Savings - Monthly Cost)
For example, if your annual savings are $45,000 (which is $3,750/month) and the new tool costs $1,500/month, your net monthly saving is $2,250. If your total upfront investment was $5,000, the payback period would be just over two months ($5,000 / $2,250). That’s a compelling story.
Level Up Your Argument with Net Present Value
Want to really impress the finance folks? Talk to them about Net Present Value (NPV). NPV is a financial concept built on a simple truth: a dollar today is worth more than a dollar tomorrow. This is because of things like inflation and the potential returns you could get from investing that dollar elsewhere.
By calculating NPV, you’re showing that you understand the time value of money, a core principle of corporate finance. While the formula itself can look a bit scary, spreadsheet tools like Excel or Google Sheets have a built-in NPV function that does all the heavy lifting for you.
You just need three pieces of information:
- Discount Rate: This is your company’s required rate of return. It’s often around 8-12%, but it’s best to just ask your finance team for the exact number they use.
- Cash Flows: These are your net savings for each period (e.g., Year 1, Year 2, Year 3).
- Initial Investment: Your total upfront cost.
A positive NPV means the investment is projected to deliver more value than it costs, even when accounting for the time value of money. It’s a green light for a financially sound decision. Understanding these concepts is also a huge help when you’re trying to figure out the true lifetime value in a SaaS context, as it grounds future potential in today’s dollars.
Putting the Calculator to Work: A Real-World Example
All the theory and formulas are great, but the true test of any saas roi calculator is seeing it in action. Let’s step away from the abstract and walk through a concrete scenario. This will show you exactly how to populate the model and, more importantly, how to turn operational improvements into a financial story that gets your CFO’s attention.
For this walkthrough, we’ll build a business case for a fixed-cost engineering solution like RevOps JET. This kind of service is perfect for our example because its value is directly tied to saving expensive, highly skilled engineering time—one of the most potent variables in our calculator.
Setting the Scene: The Problem Every RevOps Leader Knows
Picture this: you’re the Head of RevOps at a B2B SaaS company that’s scaling fast. Your senior engineers, the ones who should be building your next killer feature, are constantly being pulled into RevOps fire drills. They’re spending their days fixing broken data pipelines between Salesforce and your data warehouse, debugging quirky API integrations, and trying to make sense of a CRM schema that’s grown into a tangled mess.
You’ve done the hard work of tracking these interruptions. The final tally? Your team is losing over 300 engineering hours every single year to this kind of reactive, low-value work. It’s a massive drain on productivity, a drag on morale, and a real threat to your product roadmap. This is the classic scenario where building a solid ROI case for an outside solution makes perfect sense.
Plugging In the Costs
First things first, we need to calculate the Total Cost of Ownership (TCO) for bringing in RevOps JET. With a fixed-cost model, this part is refreshingly simple.
- Subscription Fee: The service comes in at a flat $7,995 per month. Annually, that’s a clean $95,940.
- Implementation & Training Costs: For a managed service like this, these are typically $0. There’s no software to install or new system for your team to learn.
- Ongoing Maintenance: Again, this lands at $0 from your team’s perspective. All the upkeep and support are baked into the service.
So, our total annual investment—the “I” in ROI—is a straightforward $95,940.
Calculating the Value of Getting Time Back
Now for the fun part: quantifying the return. The most immediate value comes from giving those 300+ hours back to your engineering team where they belong. To put a dollar amount on this, we need a realistic, fully-loaded hourly rate for a senior engineer.
Let’s use some conservative, real-world numbers:
- Senior Engineer Salary: $180,000
- Benefits & Payroll Taxes (we’ll estimate at 30%): $54,000
- Total Annual Cost: $234,000
- Productive Hours Per Year (2080 total minus PTO/holidays): 1,920
This gives us a fully-loaded hourly rate of $121.88.
With that rate, we can calculate the direct savings:
300 hours/year * $121.88/hour = $36,564 in direct savings
But that’s just scratching the surface. The real story isn’t just about the 300 hours saved; it’s about the full-time hire you’re avoiding. In 2025, with global SaaS spending projected to hit a staggering $295 billion, getting headcount approved is harder than ever. Sidestepping a full-time RevOps engineering hire—a role that can cost well over $650,000 when fully loaded, according to some benchmarks—is a massive win. You can dig into these kinds of numbers by reviewing the benchmarks from CFO Advisors.
For our calculator, we’ll stick with the most conservative and defensible number: the cost of a single, fully-loaded engineer.
Running the Numbers
With our investment and savings figures locked in, we can finally calculate the metrics that leadership actually cares about.
Annual Net Savings:
$36,564 (Time Saved) - $95,940 (Annual Cost) = -$59,376
Hold on—a negative number? This highlights a crucial point. If you only look at the direct time savings from a few hundred hours, you might not cover the cost of a comprehensive service. The real value is in cost avoidance. When we frame the decision as avoiding a $234,000 hire, the math looks entirely different.
Revised Annual Net Savings (via Cost Avoidance):
$234,000 (Cost Avoided) - $95,940 (Annual Cost) = $138,060
Pro Tip: I always recommend presenting both scenarios. Lead with the direct time savings as your conservative baseline, but build your primary argument around the strategic value of cost avoidance. It shows you’re thinking beyond simple math and focusing on the bigger business impact.
Payback Period:
Using our cost avoidance model, the net monthly saving is a healthy $11,505 ($138,060 / 12). Since there are no hefty upfront implementation costs, the payback is essentially immediate. You’re in the black from month one.
Total ROI (Year 1):
($138,060 Net Savings / $95,940 Investment) * 100 = 143.9% ROI
A 143.9% ROI in the first year is a number that gets attention. It clearly shows that for every dollar you invest, the company gets about $1.44 back in value. Project that out over three years, and the return becomes incredibly compelling.
ROI Calculation for RevOps JET At a Glance
Here’s a quick summary table that boils our entire scenario down to the essential numbers. It’s the perfect snapshot to include in a presentation or email to your leadership team.
| Metric | Calculation or Value | Outcome |
|---|---|---|
| Annual Service Cost | $7,995/month * 12 | $95,940 |
| Cost Avoided | Fully-Loaded Senior Engineer | $234,000 |
| Annual Net Savings | $234,000 - $95,940 | $138,060 |
| Payback Period | Immediate (Monthly Positive Cash Flow) | < 1 Month |
| First-Year ROI | ($138,060 / $95,940) * 100 | 143.9% |
This tangible example shows how a well-structured saas roi calculator does more than just justify a purchase. It transforms a simple budget request into a strategic, data-backed plan for making the entire business more efficient and financially sound.
Making Your Case: How to Present ROI for Maximum Impact

A killer ROI calculation is pointless if it doesn’t persuade anyone. You’ve crunched the numbers and built the model, but now comes the real test: getting buy-in. This isn’t about just emailing a spreadsheet and hoping for the best. It’s about telling a compelling story with your data.
Your goal here is to elevate the conversation. You need to shift the perspective from seeing this as just another line-item expense to viewing it as a strategic investment that drives the whole business forward.
Know Your Audience and Speak Their Language
A generic, one-size-fits-all presentation is doomed to fail. The secret to getting that “yes” is tailoring your story to the person sitting across the table. Different leaders are measured on different outcomes, and your ability to connect the dots for them shows you’re thinking strategically.
Let’s break down how to approach the key players:
- Your CFO: This is all about the hard numbers. Lead with the Net Present Value (NPV), the Payback Period, and the three-year Total Cost of Ownership (TCO). You’ll want to frame the investment in terms of financial responsibility and smart risk management.
- Your Head of Sales: They live and breathe pipeline and velocity. Translate the ROI into metrics that hit home for them, like faster lead-to-cash cycles or the revenue boost from more accurate lead scoring.
- Your Head of Engineering: For them, it’s all about opportunity cost. Focus on the engineering hours you’ll reclaim and how that time gets funneled back into core product development, innovation, and clearing out technical debt.
When you customize the message, you’re not just throwing numbers at them; you’re directly solving their biggest problems.
Build Credibility by Running a Sensitivity Analysis
No financial model is perfect, and smart leaders will immediately start poking holes in your assumptions. So, beat them to it by running a sensitivity analysis.
It sounds complicated, but it’s not. All you’re doing is tweaking your key inputs—like an engineer’s hourly rate or the total hours saved—to see how the final ROI changes.
A sensitivity analysis is your secret weapon for building trust. It proves you’ve thought through different outcomes and shows that the investment holds up even if things don’t go exactly as planned.
Present a few scenarios: best-case, expected-case, and worst-case. When even your “worst-case” scenario still shows a positive return, your argument becomes incredibly persuasive. This proactively handles the “what if” questions and proves your saas roi calculator is built on a solid, well-reasoned foundation.
Frame the Narrative Around Strategic Value
The numbers are your proof, but the story you tell is what sells the vision. Don’t get bogged down in the mechanics of the calculation during your presentation. Instead, use the data to support a much bigger, more strategic narrative.
Your talking points should go way beyond just saving money:
- Better Data, Better Decisions: Tie the investment directly to more reliable forecasting and business intelligence. Trusted data is the bedrock of any smart company, and exploring data-driven marketing solutions is a great way to build that capability.
- Paying Down Technical Debt: Position the tool as a way to finally address the “hidden mortgage” of technical debt that’s secretly slowing everyone down.
- Becoming More Agile: Highlight how this makes the business more adaptable. When you can build and launch new RevOps logic in days instead of months, you can react to market shifts faster than your competitors.
By linking your ROI to these big-picture goals, you turn your request from a simple departmental ask into a critical initiative for the entire business. You’re not just buying a tool; you’re investing in a more competitive and resilient future.
Got Questions About Building a SaaS ROI Calculator? We’ve Got Answers.
Even with a solid plan, you’re bound to hit a few tricky spots when building a convincing ROI calculator. Let’s walk through some of the most common questions I hear from RevOps leaders. Think of this as your field guide for nailing the details that can make or break your business case.
These aren’t just theoretical answers; they’re practical tips you can put to work right away.
How Do I Actually Figure Out Engineer Hourly Costs?
This is a big one. Get this number wrong, and your whole calculation is built on a shaky foundation. The key is to find the “fully-loaded” cost, which goes way beyond their base salary.
First, grab their gross annual salary. Then, you need to tack on all the other costs the company covers. This usually includes:
- Benefits: Things like health insurance, retirement plans, and other perks typically add another 25-40% on top of their salary.
- Payroll Taxes: Don’t forget the employer-side taxes—they’re a real and significant expense.
- Essential Tools: Factor in any software licenses, hardware, or professional development budgets they need to do their job.
Once you have that total annual number, divide it by the productive hours they work in a year. A standard year has 2,080 work hours (40 hours/week x 52 weeks), but nobody is productive for every single one of those hours. A much more realistic figure subtracts PTO, holidays, and training, usually landing you somewhere between 1,800-1,900 hours.
That final, fully-loaded rate is the true cost you’re saving for every hour they don’t have to spend wrestling with manual RevOps tasks.
What Are the Biggest Mistakes People Make With These Calculators?
I’ve seen a few common pitfalls sink an otherwise solid business case before it ever reaches the CFO’s desk. The number one mistake? Focusing only on the direct software license fee while totally ignoring the huge “soft” costs and benefits.
This means people often underestimate the time their own teams spend on maintenance, squashing bugs, and patching together frustrating workarounds. It’s that invisible drag on productivity that secretly eats away at your budget.
Another classic mistake is failing to put a number on opportunity cost.
Every hour your best engineer spends fixing a Salesforce sync is an hour they’re not spending on your core, revenue-generating product. That’s a real, tangible loss to the business.
Finally, just presenting a single, static ROI number feels flimsy. It’s far more powerful to show a sensitivity analysis. When you can demonstrate that the investment still pays off even if some of your assumptions are a little high or low, you build a ton of credibility and show you’ve thought through the different possibilities.
Can I Use This Same Framework for Other Tools?
Absolutely. The logic and formulas we’ve been using are pretty universal for almost any B2B SaaS investment. Whether you’re looking at a new CRM, a marketing automation platform like Marketo, or a data visualization tool, the core principles don’t change.
You always need to:
- Map out all the costs to get the Total Cost of Ownership (TCO).
- Quantify all the upsides, from direct cost savings and productivity boosts to potential revenue growth.
- Use standard financial metrics like Payback Period and NPV to wrap it all up into a compelling story.
The only thing that changes is the specific inputs. For a sales tool, the benefit might be a shorter sales cycle; for a data tool, it might be reducing the risk that comes from making bad decisions. Just be diligent about identifying the right variables for the tool you’re evaluating.
How Can I Measure the ROI of Something “Intangible”?
Trying to quantify a fuzzy concept like “reduced technical debt” can feel like grabbing smoke, but it’s totally doable. The trick is to find a tangible proxy—a real metric that reflects the intangible problem.
For instance, you could track the number of hours your engineering team spends per month on unplanned work or bug fixes tied to the old system you want to replace. Or, you could measure the lead time for new requests. If a simple change that should take a day ends up taking weeks because of system complexity, that’s a quantifiable delay with a very real cost.
By swapping a debt-ridden system for a clean, managed solution, you can forecast a massive drop in those “unplanned work” hours. That translates directly into saved engineering costs and, maybe more importantly, a faster time-to-market for new business initiatives. Suddenly, a vague idea becomes a hard number on a spreadsheet.
Ready to stop burning expensive engineering hours on reactive RevOps fixes? RevOps JET provides dedicated, production-grade engineering for a fixed monthly fee. We build the reliable data pipelines, scalable CRM architecture, and resilient integrations you need to move faster.