If you’ve ever felt like your sales team is just spinning its wheels, the sales velocity formula is the metric you need. Think of it as a speedometer for your revenue engine. It tells you exactly how fast you’re converting qualified leads into actual cash in the bank over a set period.
What Is the Sales Velocity Formula Anyway?

Imagine your sales pipeline is a highway. Sales velocity tells you if your revenue “car” is cruising along in the fast lane or stuck in a bumper-to-bumper traffic jam. It’s a single number, but it’s packed with insight, giving you a powerful diagnostic tool to check the health and efficiency of your entire sales process.
This isn’t some vanity metric to stick on a dashboard and forget about. It’s a composite measure built from four fundamental sales components. Once you understand these individual parts, you can see exactly which “levers” to pull to speed things up. A low velocity might point to a painfully long sales cycle or a leaky win rate, while a high velocity shows your team is closing valuable deals like clockwork.
By monitoring sales velocity, businesses get a clear view of the bottlenecks, strengths, and opportunities hiding in their sales process. It’s the key to creating a truly predictable revenue forecast.
The formula helps you move beyond just looking at the total revenue number. It forces you to ask a more important question: how efficiently are we actually generating that revenue?
The Four Levers of Your Sales Engine
To really get a handle on sales velocity, you need to break it down into its four core components. Each one is a distinct part of your sales performance, and improving any of them will give your overall velocity a boost. Think of them as the engine, fuel, tires, and driver of your revenue car—you need all four working together to get where you’re going quickly.
Here’s a look at what makes up your sales engine.
The Four Levers of Your Sales Engine
| Component | What It Measures | Why It Matters |
|---|---|---|
| Number of Opportunities | The total qualified deals in your pipeline during a specific period. | This is the raw material for your sales engine. More high-quality opportunities mean more potential revenue to work with. |
| Average Deal Size | The average dollar value of each closed-won deal. | This represents the quality of your fuel. Bigger deals mean more revenue from each win, giving you more bang for your buck. |
| Win Rate | The percentage of opportunities that you successfully turn into customers. | This is your engine’s efficiency. A higher win rate means you’re converting more of your pipeline into actual revenue. |
| Sales Cycle Length | The average time it takes for a deal to go from creation to close, usually measured in days. | This is all about speed. A shorter cycle means you’re bringing in revenue faster, which directly increases your velocity. |
By bringing these four factors together, the sales velocity formula gives you a complete, holistic view of your sales health. The real magic isn’t in obsessing over just one element, but in understanding how they all interact to drive predictable and sustainable growth.
Calculating Your Sales Velocity Step by Step
Alright, you understand the theory. Now, let’s roll up our sleeves and actually run the numbers. Don’t worry, this isn’t as complicated as it might seem. The good news is that all the data you need is probably sitting right inside your CRM, waiting to be used.
To make this real, we’ll walk through an example using a fictional B2B SaaS company I’ll call “ConnectSphere.” My goal here is to give you a clear, repeatable process for digging up the right data and plugging it into the formula.
The engine behind this whole analysis is the core sales velocity formula. It’s a beautifully simple equation that connects the four main levers of your sales process.
Sales Velocity = (Number of Opportunities × Average Deal Size × Win Rate) ÷ Sales Cycle Length
What this formula really tells you is how much revenue your team is generating, on average, every single day. It’s a dollar amount per day—a straightforward metric you can track, benchmark, and most importantly, improve.
Step 1: Gather Your Four Key Metrics
First things first, you need to collect the raw data for each of the four components. The key here is consistency, so you’ll want to define a specific time period for your analysis. For ConnectSphere, we’ll use the last 90 days. This is a great starting point because it’s long enough to smooth out any random weekly spikes or dips but recent enough to reflect your current reality.
Here’s exactly what to look for in your CRM, whether it’s Salesforce, HubSpot, or something else:
-
Number of Opportunities (#): Find all newly qualified opportunities created within your 90-day window. This is critical—we’re not talking about every lead that comes in the door. These are prospects who have met your specific qualification criteria (like BANT or MEDDPICC). For our example, let’s say ConnectSphere generated 150 qualified opportunities.
-
Average Deal Size ($): This one’s pretty simple. Look at all the deals you closed as won during the same 90 days. Add up the total revenue from those wins and divide it by the number of deals won. We’ll say ConnectSphere’s average deal size is $12,000.
-
Win Rate (%): This is just the percentage of opportunities that you successfully closed. To get this number, divide the number of deals won by the total number of deals closed (both won and lost) in the last 90 days. If ConnectSphere won 30 deals and lost 90, their win rate is 30 / (30 + 90), which comes out to 25%.
-
Sales Cycle Length (Days): Last but not least, you need to figure out how long it takes to close a deal. Calculate the average number of days it took to close the won deals in your chosen timeframe. Typically, this is measured from the day an opportunity was created to the day it was marked closed-won. For ConnectSphere, we’ll use an average sales cycle of 60 days.
By the way, these four components aren’t just for this formula; they are fundamental sales KPIs that any high-performing RevOps team should be watching like a hawk. For more on this, check out our guide on the top sales KPIs with examples.
Step 2: Put the Formula into Action
Now for the easy part. With your four numbers in hand, it’s just a bit of multiplication and division. Let’s plug ConnectSphere’s data into the sales velocity formula.
- Opportunities: 150
- Average Deal Size: $12,000
- Win Rate: 25% (or 0.25 in the formula)
- Sales Cycle: 60 days
Calculation: (150 Opportunities × $12,000 × 0.25) ÷ 60 Days
The math works out to $450,000 ÷ 60 Days, which equals $7,500 per day.
That final figure, $7,500, is ConnectSphere’s sales velocity. It’s a direct measure of their sales engine’s health, telling them they’re generating revenue at a rate of $7,500 every single day. This isn’t just a static report; it’s a living number that gives you a baseline to measure all your future efforts against. You can find more examples of how different companies apply this calculation by exploring various resources on sales velocity. Discover more insights about how to calculate sales velocity on Pipedrive.com.
How to Benchmark Your Sales Velocity
So, you’ve run the numbers and calculated your sales velocity. Let’s say it’s $7,500 per day. Great! Now what?
A number like that floating in a vacuum doesn’t tell you much. Is it good? Is it terrible? The real answer isn’t about chasing some magic industry-wide figure; it’s about figuring out what that number actually means for your business.
Benchmarking your sales velocity is less about keeping up with the Joneses and more about setting a clear baseline for your own growth. The most powerful benchmark you have is your own historical performance. Seriously, your velocity from last quarter is a much better yardstick than the velocity of a company in a totally different market.
The ultimate goal isn’t to hit an arbitrary industry average. It’s to consistently improve your own sales velocity over time, turning your sales engine into a more efficient, predictable revenue machine.
Comparing Against Yourself First
Your primary benchmark should always be your past self. Start by tracking your sales velocity on a rolling basis—monthly, quarterly, and annually. This internal comparison is how you spot trends, account for seasonality, and see the true impact of the changes you’re making.
Think about it. Did you launch a new sales training program last quarter? Roll out a new pricing tier? By comparing your current velocity to your historical data, you can connect the dots and see what moved the needle. This is how you shift from guesswork to making sharp, data-driven decisions.
Understanding Industry Differences
While your own history is the best guide, a little outside context is still useful for setting ambitious yet realistic goals. There’s simply no such thing as a one-size-fits-all “good” sales velocity. The number swings wildly depending on your business model, who you sell to, and how complex your product is.
A company selling high-volume, low-cost SaaS to small businesses is playing a completely different game than one selling six-figure enterprise solutions. The first might have a lightning-fast sales cycle and smaller deals, while the other has a much longer cycle but lands massive contracts. Both can be incredibly successful, but their velocity numbers will look worlds apart.
To put some numbers on it, a 2022 survey of 1,000 US firms by Richardson Sales Performance found that top-quartile teams hit a daily velocity over $3,000, which was double the median of $1,500. The secret sauce? A 28% higher win rate. Other data points to average SaaS deal sizes around $12,000 with win rates of 18-25%, which could put daily velocity anywhere from $3,000 to $8,000 for a scaling company. You can dig into more sales velocity benchmarks at intuendi.com.
This just goes to show how much performance can vary. Use these numbers as a directional guide, not a strict target to live or die by.
Sales Velocity Benchmarks Across B2B Segments
To give you a clearer picture of how these metrics can differ, we’ve put together a table showing some typical values across different B2B segments. This isn’t gospel, but it provides a helpful framework for understanding where your own numbers might fit in the broader landscape.
Sales Velocity Benchmarks Across B2B Segments
A comparative look at average sales velocity components for different B2B market segments, highlighting key differences.
| B2B Segment | Avg. Deal Size | Avg. Win Rate | Avg. Sales Cycle (Days) | Typical Daily Velocity |
|---|---|---|---|---|
| SMB SaaS | $5,000 - $15,000 | 20% - 30% | 30 - 60 | $1,500 - $5,000 |
| Mid-Market | $25,000 - $75,000 | 15% - 25% | 60 - 120 | $4,000 - $10,000 |
| Enterprise | $100,000+ | 10% - 20% | 120 - 240+ | $8,000 - $20,000+ |
As you can see, a daily velocity of $5,000 might be phenomenal for a team focused on SMBs, but it could be a red flag for an enterprise sales team. Context is everything.
Once you understand these nuances, you can stop obsessing over a single number and start asking the right questions to drive real, meaningful improvement.
Actionable Strategies to Boost Your Sales Velocity
Knowing your sales velocity is the first step. Actually improving it? That’s where the real growth kicks in. Since the sales velocity formula is built on four distinct levers, you’ve got four clear paths to rev up your revenue engine. The secret is to focus on making small, consistent gains in each area rather than trying to boil the ocean all at once.
Even a few strategic tweaks to just one of these components can make a huge difference. Let’s break down some practical, real-world tactics you can use to nudge each of the four variables in the right direction and get your velocity climbing.
Increase Your Number of Qualified Opportunities
More fuel in the tank gives your engine more to burn. But simply dumping more leads into the top of the funnel isn’t the answer. The goal here is to increase the number of qualified opportunities, which means prioritizing quality over sheer quantity.
In fact, low-quality leads can actually slow you down by clogging up the pipeline and making your reps waste precious time on prospects who were never going to buy anyway.
Here are a few ways to boost your qualified opportunity count:
- Refine Your Ideal Customer Profile (ICP): Get laser-focused on who your best customers really are. Dive into your closed-won deals and look for common threads—industry, company size, tech stack, pain points—then aim all your marketing and sales efforts at prospects who fit that mold.
- Strengthen Sales and Marketing Alignment: Get both teams speaking the same language and using the same rulebook for what makes a lead “qualified.” When marketing is teeing up high-intent leads that sales genuinely wants to talk to, your pipeline fills with opportunities ready to move.
- Implement a Lead Scoring Model: Use data to automatically prioritize your inbound leads. By assigning points based on demographics, firmographics, and online behavior (like visiting a pricing page), your reps can instantly zero in on the prospects most likely to convert.
Grow Your Average Deal Size
Increasing the value of each sale is one of the most direct ways to pump up your sales velocity. Even if your win rate and sales cycle length stay exactly the same, bigger deals mean more revenue in the same amount of time. This usually requires a shift from just selling a product to providing real, tangible value.
Think about how you can solve bigger problems for your customers. That’s what justifies a higher price point.
The goal isn’t just to sell a product; it’s to become a strategic partner. When you can clearly show the ROI and solve deep-seated business pains, customers are willing to invest more.
Consider these strategies to bump up your average deal size:
- Master Upselling and Cross-selling: Train your reps to spot opportunities where a premium tier or an add-on product could deliver even more value. This should feel like a natural part of the conversation, not a tacked-on sales pitch at the end.
- Bundle Products or Services: Create packages that solve a complete problem. Bundling often increases the perceived value and encourages customers to commit to a more comprehensive solution right from the start.
- Avoid Excessive Discounting: While a strategic discount can sometimes be the final nudge a deal needs, relying on it too often just chips away at your value. Focus on selling the ROI your solution delivers, not on being the cheapest option on the block.
Below is a map that illustrates how to think about benchmarking your sales velocity—comparing it against your own history and what’s happening in your industry.
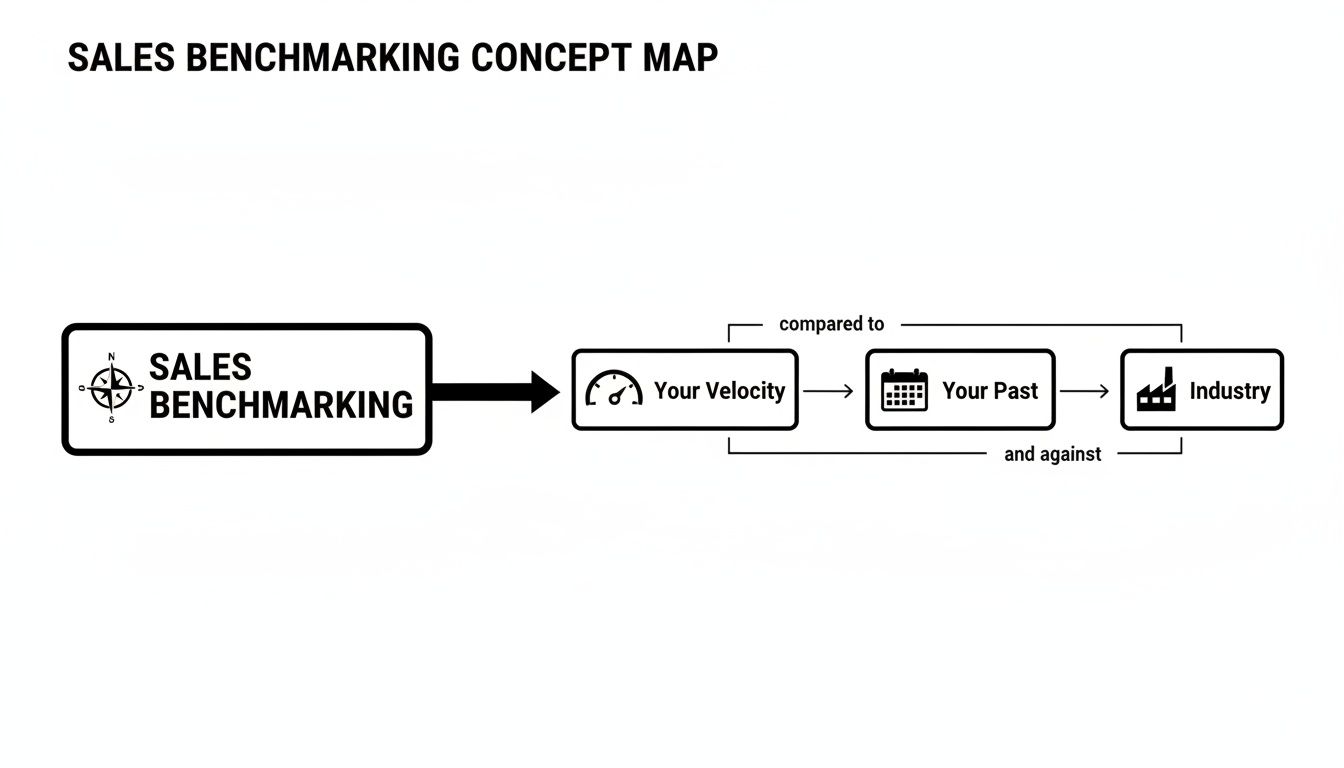
This reinforces that the most important comparisons are often internal, tracking your own progress over time while keeping an eye on the broader industry context.
Improve Your Win Rate
Your win rate is a direct reflection of how effective your sales team is. A higher win rate means you’re turning more of those hard-earned opportunities into paying customers, making your entire sales motion more efficient. Even a small bump here can create a massive ripple effect across your overall velocity.
Improving your sales conversion rate usually comes down to better processes, better training, and better execution on the ground. For a deeper look, check out our guide on how to calculate and improve your sales conversion rate.
Here’s how to get started:
- Provide Continuous Sales Coaching: Use data from call recordings and CRM activity to see where reps are getting stuck. Offer targeted coaching on specific skills like handling objections, positioning against competitors, or running killer discovery calls.
- Uncover the Entire Buying Committee: In B2B sales, you’re almost never selling to just one person. Work to identify all the key stakeholders and decision-makers early on to prevent a surprise objection from a mystery stakeholder from derailing the deal at the last minute.
- Define Clear Next Steps: Never let a deal go cold because of ambiguity. Every single prospect interaction should end with a clear, mutually agreed-upon next step. This keeps the momentum going.
Shorten Your Sales Cycle
The faster you can move a deal from “new opportunity” to “closed-won,” the faster you get to recognize that revenue. Shortening your sales cycle is all about removing friction from the buyer’s journey and streamlining your own internal workflows. Hunt for the bottlenecks where deals always seem to slow down or get stuck.
- Automate Administrative Tasks: Free up your reps’ time by automating the soul-crushing admin work like data entry, scheduling, and follow-up reminders. This lets them spend more time actually talking to prospects.
- Improve Sales Enablement Resources: Make sure your team has the right content at the right time. Things like case studies, testimonials, and ROI calculators help prospects build the business case internally and move through decisions faster.
- Streamline the Contracting Process: Don’t let a deal die in legal or procurement. Use e-signature tools and standardized contract templates to make the final closing stage as smooth and painless as possible for everyone involved.
Tracking Sales Velocity in Your RevOps Stack
Let’s be honest, calculating sales velocity in a spreadsheet is interesting, but seeing it live on a dashboard is where the magic really happens. For any RevOps pro, the goal is to weave this metric into the very fabric of your tech stack. It’s not just a number you check once a quarter; it becomes the real-time heartbeat of your entire sales engine.
But before you can get there, we have to talk about the foundation: clean, reliable data. You’ve heard it a million times, but “garbage in, garbage out” is the first commandment of data analytics for a reason. If your CRM isn’t the absolute source of truth—with every stage change, close date, and deal amount logged meticulously—your velocity calculation will be meaningless. It’s that simple.
The real aim here is to shift from reactive reporting to proactive insight. A living, breathing sales velocity dashboard doesn’t just tell you what happened last month. It gives you a glimpse of where you’re headed next week and flashes a warning light when you start to veer off course.
Once you’ve wrestled your data into shape, the fun part begins: modeling it all so you can actually calculate the four key components of the formula.
Modeling Your Data with SQL and dbt
To get this right, you’ll need to pull information from a few different places in your CRM, usually the Opportunity, Account, and User objects. The modern, and frankly most reliable, way to do this is with SQL in a data warehouse like Snowflake and a transformation tool like dbt.
A great starting point is to build a single, centralized “opportunities” model. Think of this as your master table that joins all the important fields together and calculates key metrics on the fly, like how old a deal is—which is exactly what you need to figure out your sales cycle.
Here’s a taste of what that looks like in a dbt model. This simplified SQL snippet is a good example of how you might calculate the sales cycle for each opportunity:
SELECT opportunity_id, created_date, close_date, is_won, amount,
— Calculate sales cycle in days for won deals CASE WHEN is_won = TRUE THEN DATE_DIFF(close_date, created_date, DAY) ELSE NULL END AS sales_cycle_days
FROM {{ source(‘salesforce’, ‘opportunity’) }}
This piece of code sets the stage for everything else. From here, you can easily average the sales_cycle_days across all your won deals for a specific period. You’d do something similar to count your opportunities, find the average deal size, and calculate your win rate. Using a tool like dbt is a game-changer because it brings version control, testing, and documentation to your data work, making it way more robust.
This screenshot from dbt’s website shows a data lineage graph, which is a perfect visual for what we’re talking about. It maps how raw data gets transformed into clean, trustworthy models ready for your dashboards.
Every little node in that graph is a step in your data pipeline, giving you complete confidence that the numbers on your dashboard are solid.
Building Your Data Pipeline and Dashboards
With your data modeled and clean, it’s time to build the pipeline that will feed your analytics tools. One of the first questions to answer is how often the data should refresh. For a strategic metric like sales velocity, a daily refresh is usually the sweet spot. It gives leaders a consistent day-over-day view without the distracting noise of what’s happening minute-to-minute.
Once that data is flowing into a BI tool—whether it’s Tableau, Looker, or Power BI—you can build out your dedicated sales velocity dashboard. A killer dashboard doesn’t just show the final velocity number; it visualizes the trends of the four components over time. This is huge because it lets anyone instantly see why velocity is moving up or down.
Here are a few things every great velocity dashboard needs:
- KPI Scorecards: Put the big numbers front and center. Show the current sales velocity and each of its four drivers for the current period (like this quarter).
- Trend Lines: Plot your daily or weekly sales velocity over the past year. This is the best way to spot seasonality and see your long-term momentum.
- Component Breakdowns: Dedicate a chart to each of the four levers: opportunities, deal size, win rate, and sales cycle. This lets you drill down and see which one is really moving the needle. For more on the tools that can help you manage these areas, check out our guide on essential SaaS for sales teams.
Finally, the most sophisticated RevOps teams don’t just stop at dashboards; they build action engines with automated alerts. Imagine setting up a rule that pings the Head of Sales in Slack if the 7-day average win rate dips by more than 10%, or if new qualified opportunities fall below a critical threshold. This is how you turn your data from a passive report into an active co-pilot for your entire sales organization.
Common Pitfalls When Using the Sales Velocity Formula
While the sales velocity formula is a fantastic diagnostic tool, treating it as a simple number to chase can lead you down a dangerous path. Think of it as a speedometer, not a scoreboard. Chasing a higher number at all costs often backfires spectacularly.
One of the most common traps is sacrificing deal quality for speed. Sure, a team might shorten their sales cycle by rushing deals through the pipeline. But this often leads to smaller contracts, higher churn rates, and customers who were never a great fit to begin with. A high velocity built on shaky deals is just empty calories for your revenue engine.
Focusing on Just One Lever
Another classic mistake is getting tunnel vision. It’s easy to get obsessed with juicing just one component of the formula—like pushing reps to crank up their win rate. The problem is, if they hit that higher win rate by only cherry-picking small, easy-to-close deals, your average deal size will plummet. This can actually lower your overall velocity.
The four levers of the sales velocity formula are interconnected. Pushing one too hard without considering the others can throw your entire sales motion out of balance.
Ignoring Data Quality
At the end of the day, your calculation is only as good as the data feeding it. The formula becomes completely useless if your CRM data is a mess. Inaccurate close dates, inconsistent opportunity stages, or missing deal values will give you a velocity number that’s completely detached from reality. Garbage in, garbage out.
To sidestep these traps, you have to treat sales velocity as a holistic health metric. Look at the balance between the four components and, for goodness’ sake, make sure your underlying data is pristine. A healthy, sustainable velocity is always better than a high, volatile one.
Your Top Sales Velocity Questions, Answered
Once you start digging into the sales velocity formula, a few practical questions almost always pop up. Let’s walk through some of the most common ones I hear from teams, so you can put this metric to work with confidence.
How Often Should We Calculate Sales Velocity?
The right cadence really depends on what you’re trying to accomplish.
For high-level strategic planning and spotting long-term trends, a monthly or quarterly calculation is your best bet. This approach smooths out any week-to-week noise and gives you a much clearer picture of your sales engine’s overall health.
But if you’re a sales manager looking to make more tactical, in-the-weeds adjustments, a weekly or bi-weekly calculation can be a game-changer. It helps you catch problems early—like a sudden dip in new opportunities—and step in before they throw off the entire quarter.
Can This Formula Measure Individual Rep Performance?
Technically, yes. You can absolutely run the sales velocity formula for an individual sales rep. It can give you a more rounded view of their performance than just quota attainment, as it bakes in their deal size, win rate, and cycle time.
A word of caution, though: be careful with how you use it. If you make it the primary performance metric, you might accidentally encourage reps to chase smaller, faster deals just to pump up their velocity, while ignoring bigger, more strategic accounts. It’s far better as a diagnostic tool for coaching rather than a public leaderboard.
A rep’s velocity can be incredibly insightful for a manager. A long sales cycle might mean they need coaching on creating urgency. A low win rate could point to a weakness in their qualification process.
What’s the Difference Between Sales Velocity and Pipeline Coverage?
This is a great question. These two metrics are partners in crime, but they measure very different things.
- Sales Velocity: This is all about speed. It tells you how quickly your pipeline is turning into actual revenue (e.g., you’re generating $5,000 per day).
- Pipeline Coverage: This is about volume. It measures the size of your pipeline against your quota (e.g., a 3x coverage ratio means you have three times your sales target in your open pipeline).
Here’s an analogy I like to use: pipeline coverage tells you if you have enough gas in the tank to get where you’re going. Sales velocity tells you how fast your car is actually driving. You need to know both to have any real confidence in your forecast.
Ready to stop wrestling with messy CRM data and build the reliable data pipelines you need to track metrics like sales velocity? RevOps JET provides on-demand RevOps engineering to design, build, and maintain your entire data stack, from Salesforce to Snowflake and beyond. Learn more about our fixed-fee model and how we can save you hundreds of engineering hours.